Did you ever wonder about the current load of the power grid? That is of the whole bunch of power plants that is currently feeding our wall sockets? As it turns out this can be measured easily with the Blinkenlight shield and some simple external parts.
Let me first have a simplified look at the theory. Due to the law of conversation of energy the energy pushed into the grid must equal the energy pulled out of it. Since the grid is basically a lot of wires and connections it has no significant storage capacity. At any point in time the input equals the output. What will happen if additional load is added or removed? What happens if the demand varies? The power production will be regulated to fit the changing demand. This is a really tricky engineering problem. One of the issues is that power plants can not ramp up or down within a fraction of a second. Here comes the interesting question: where does the missing energy come from until the additional demand can be satisfied? Where does excess energy go until the production goes down?
To understand this look at the standard power plant setup. A turbine driving a generator. For the sake of this example suppose it is a steam power plant. Suppose the load suddenly goes up. Then the generator will pull more energy than the turbine can provide. The controllers will heat up the boilers to provide more steam. It will take quite some time till additional steam reaches the turbine. Till then the turbine and generator will continue to rotate due to their initial mass. However they will slow down. If the load suddenly becomes less the same will happen but with opposite signs. The generator will speed up.
Now here comes the important point: the frequency of the generated current for this kind of power plant is directly linked to the speed of the generator. If the demand exceeds the supply the frequency will go down. On the other hand if the supply exceeds the demand the frequency will go up.
For the power grid this is basically the same although the issues are more complicated. The point is that the power plants must be kept in sync. In the extreme case where a power plant would be out of sync by ½ period it would be feeding into a giantic short circuit. Needless to say that this kind of situation must be avioded. This issue is so critical that frequency deviations are usually kept below 0.2 Hz. If frequency deviations / phase shifts become to high parts of the grid will be disconnected and/or shut down to protect from damage.
The whole point of this explanation is that the frequency deviations are an indicator of what is going on in the grid. The task of the Arduino / Blinkenlight shield will be to indicate frequency deviations.
Since 50 Hz is a comparatively low frequency for the Arduino the frequency could be monitored with fourier transforms and similar sophisticated means. But I found a much simpler way. We will proceed like in the previous experiment. We will sweep with 50 Hz and feed the mains frequency into the common cathode. If the mains frequency is stable we will see a stable pattern. Otherwise we will see movement. Since power grid frequency deviations are usually below 0.2 Hz this can be easily seen.
The 50 Hz version of the sketch uses the MsTimer2 Library. It will provide ticks at 1ms. Since the Blinkenlight shield has 20 LEDs we will shift by 1 LED per phase for a total of 20ms per period.
//
//	www.blinkenlight.net
//
//	Copyright 2011 Udo Klein
//
//	This program is free software: you can redistribute it and/or modify
//	it under the terms of the GNU General Public License as published by
//	the Free Software Foundation, either version 3 of the License, or
//	(at your option) any later version.
//
//	This program is distributed in the hope that it will be useful,
//	but WITHOUT ANY WARRANTY; without even the implied warranty of
//	MERCHANTABILITY or FITNESS FOR A PARTICULAR PURPOSE. See the
//	GNU General Public License for more details.
//
//	You should have received a copy of the GNU General Public License
//	along with this program. If not, see http://www.gnu.org/licenses/


// http://en.wikipedia.org/wiki/Utility_frequency
// https://www.entsoe.eu/system-operations/the-frequency/
// http://www.mikrocontroller.net/topic/69366

#include <MsTimer2.h>

void iterate() {
	static int8_t phase = 19;

	digitalWrite(phase, LOW);

	--phase;
	if (phase < 0) { phase = 19; }

	digitalWrite(phase, HIGH);
}

void setup() {
	DDRD = 0b11111111; // set digital  0- 7 to output
	DDRB = 0b00111111; // set digital  8-13 to output
	DDRC = 0b00111111; // set digital 14-19 to output (coincidences with analog 0-5)

	// trigger each millisecond --> 20 steps in 20 milliseconds --> 50Hz
	MsTimer2::set(1, iterate);
	MsTimer2::start();
}

void loop() { }
The 60 Hz version for the US is slightly more complicated because I did not find a similar library that would provide me with 1200 Hz ticks. I will use timer 1 to provide the required interrupts.
//
//	www.blinkenlight.net
//
//	Copyright 2011 Udo Klein
//
//	This program is free software: you can redistribute it and/or modify
//	it under the terms of the GNU General Public License as published by
//	the Free Software Foundation, either version 3 of the License, or
//	(at your option) any later version.
//
//	This program is distributed in the hope that it will be useful,
//	but WITHOUT ANY WARRANTY; without even the implied warranty of
//	MERCHANTABILITY or FITNESS FOR A PARTICULAR PURPOSE. See the
//	GNU General Public License for more details.
//
//	You should have received a copy of the GNU General Public License
//	along with this program. If not, see http://www.gnu.org/licenses/


// http://en.wikipedia.org/wiki/Utility_frequency

ISR(TIMER1_COMPA_vect) {
	static int8_t phase = 19;

	digitalWrite(phase, LOW);

	--phase;
	if (phase < 0) { phase = 19; }

	digitalWrite(phase, HIGH);
}


void setup() {
	DDRD = 0b11111111; // set digital  0- 7 to output
	DDRB = 0b00111111; // set digital  8-13 to output
	DDRC = 0b00111111; // set digital 14-19 to output (coincidences with analog 0-5)

	// Trigger with 60Hz == each 1/60s == each 16 000 000/60 cycles.
	// We have 20 phases per period, each phase will last 16 000 000/(60*20) == 13 333 + 1/3 cycle.
	// Our frequency generator will be to fast by 1/3 * 20 * 60 cycles/s == 400 cycles/s. Thus the generated frequency will be slightly to high.
	// The error is about 400 / 16 000 000 == 25ppm.
	// Since 25ppm is in the order of magnitude of the crystal's deviation we will not compensate for this.

	// disable timer1 interrupts
	TIMSK1 = 0;

	// Mode 4, CTC using OCR1A | set prescaler to 1
	TCCR1A = 0;
	TCCR1B = (1<<WGM12) | (1<<CS10);

	// Set OCR1A for running at 1200 Hz (because we have 20 discrete phases per period and want to have 60 Hz)
	OCR1A = (F_CPU / (60*20)) - 1;

	// enable match interrupts
	TIMSK1 = 1<<OCIE1A;
}

void loop() { }
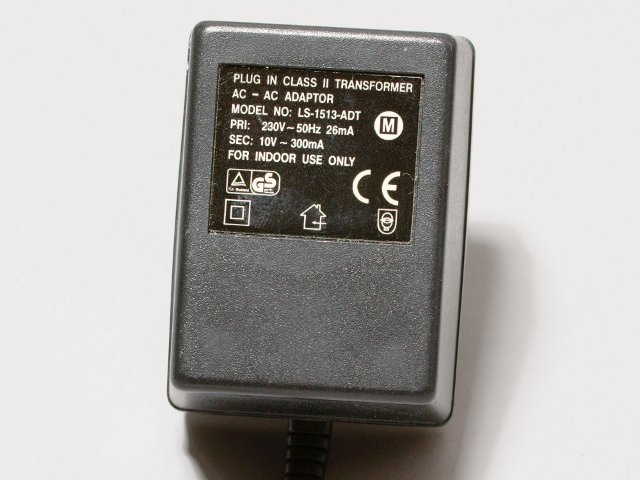
The final question is how to feed the mains frequency into the Blinkenlight shield without damaging the shield or electrocuting the experimenter. In my junk box I found an old AC 10V 300mA wall wart of unknown origin. The only important property is that it outputs low voltage AC.
Other reasonable low voltage AC sources are halogen transformers. If you have neither you might open up a DC converter (not recommended) or buy some AC converter from a surplus store (recommended).
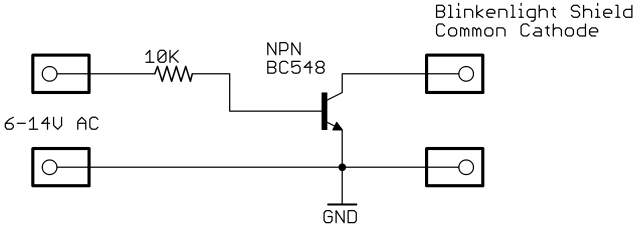
I then connected a resistor and some transistor to feed the shield.
The video below shows the setup at nighttime. What youobserve is that the grid is “catching up”. That is it is running slightly above 50 Hz to compensate for the lag cumulated during daytime. You can also see that it fluctuates very little during the night.
If you try this experiment during daytime you will see considerably more “action”. That is frequency will fluctuate significantly more. However the video shows that this simple setup will still capture deviations as small as 1/100 Hz (~200ppm). Of course the frequency counter is not needed to repeat this experiment. It serves as a reference only. As we can see the mains frequency is of by ~200ppm or more. Hence even Arduinos with very poor crystal precision will be suitable for this experiment.
If you prefer a “real” measurement instead of my phase detector style approach you might want to read my Power Grid Monitor 2 Experiment”.


Thanks..I am enlightened by a big bit !..
Recently I notice that the power grid monitor page receives significant attention from Italy. I still wonder why. Will anyone from Italy please tell me why this page is suddenly so popular?
Udo- excuse my electronic ignorance, I cannot see which connections to make from the two outputs, i.e. where on the blinkenlights do I connect to??
Have a look at the layout https://blog.blinkenlight.net/experiments/hardware/layout/. There are 3 pins for the Jumper: GND, CC and 5V. Common Cathode (CC) is the middle pin that is not labeled. Or look at this picture https://blog.blinkenlight.net/experiments/hardware/schematics/. The transistor will connect cc and ground at the two pins that are connected with the red jumper bridge.
Many thanks for very prompt reply.
Very interesting…. supposedly we will be having Internet through the power grid soon. No wonder’
Hey sir,
I need your help for designing a project using arduino uno and usb shield.
I want to monitor the operating time of an electrical device like TV ,
And save results to show on computer.
I’m not specialized in this field but i search and get information but i still can’t perfom my project and it’s very important .
I’ll be very thankful for your help.
My best Wishes dear.
Hi Ahmed,
of course I can help you. Please be aware that I will charge you for my time though.
Best regards, Udo